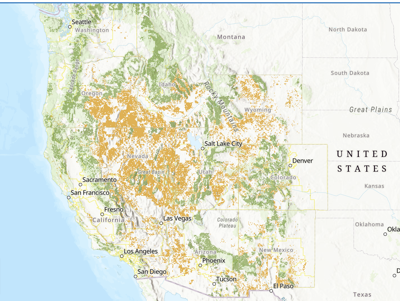

Katie Rodriguez here. Last week I spoke with Michael Carroll, campaign director of the Wilderness Society, about a particular provision in the “One Big Beautiful Bill” that would have made millions of acres of land managed by the Bureau of Land Management and U.S. Forest Service eligible for sale—which included areas in Monterey County.
Since then, things have moved quickly—the Senate today, July 1 approved the latest version of the bill, which now heads back to the House for approval before going to President Donald Trump’s desk.
But first, some good news: The provision I spoke with Carroll about was removed from the bill after facing backlash from both sides of the aisle. The original language would have made 250-plus million acres of public lands eligible for sale, not to mention mandated that a portion be sold within five years. The provision, introduced by Sen. Mike Lee of Utah, aimed “to put underutilized federal land to work for American families,” according to a public statement.
What brought meaningful attention to this proposal was a map released by the Wilderness Society, which visualized where these potential land sales could happen. The highlighted areas included parts of Big Sur (near Andrew Molera and Pfeiffer Big Sur state parks), Carmel Valley, and the mountain ranges west of Soledad—along with BLM and Forest Service lands near Lake Tahoe and across Idaho, Utah and other treasured outdoor spaces.
The map turned obscure legislative language—often unreadable for the general public—into a visual story about what was at stake. The internet lit up when people realized their favorite hiking or hunting spots could be sold to oil and gas, or private interests.
Carroll explained what went into building the map released by the Wilderness Society: obtaining leaked drafts of earlier proposals from Lee, identifying the right datasets, and working with experts who could interpret the technical details and translate them into geographic information.
In short, it took preemptive planning—and access to leaked documents—to quickly deliver the information in a digestible way the public could understand.
“That gave us the ability to just quickly shift and recalculate our maps focused on his legislation,” Carroll says. “The legislative language is obscure—even for professionals like myself. Sometimes you have to read it 10 times just to fully understand what it means.”
That one provision was stripped—but others are moving forward with far less attention.
At the time of this publication, the final text of the bill passed by the Senate with a 51-50 vote had not yet been released. The House now has two-and-a-half days to vote in order to meet Trump’s July 4 deadline. Regarding climate-related provisions, Senate Republicans added more flexibility to a controversial tax on solar and wind energy projects, following pushback from clean energy groups, according to Politico. The bill has also proposed massive funding cuts to the Supplemental Nutrition Assistance Program (SNAP) or food stamps, as well as Medicaid—$1 trillion—according to Civil Eats.
“I wasn’t surprised they moved so quickly,” Carroll says, when asked if the Senate’s passage of the bill caught him off guard. “I’ve been more surprised that we haven’t seen a greater backlash across the board from all the different sectors.
“I think people are raising their voices and trying to push back, but I think they’re underestimating the impact this legislation is going to have—and what’s still to come.”
I can’t help but wonder, if people were able to visualize those other sweeping changes—the way they saw the public land sell-off—would we be in a different place today?


(1) comment
Your article would have made more sense if the map you posted would have had some kind of ledgeng describing the differences in the colored areas on the map and what they actually were meant to show. The fact that you said these werew areas that "might" be subject to lease or sale is a big leap to what would be sold. I take it the map was supposed to make people thjink that all that area was going to be sold off. The fact of the matand it ter is that is that it was more like 2.5 million acres of the total close to 700 million acres that the federal government owns and it was mostly for land close to urban areas where infrastructure was assessable to build affordable housing. The federal government owns land all over the country and I have not seen any evidence that they are going to lease or sell the Big Sur Coastline
Welcome to the discussion.
Log In
Keep it Clean. Please avoid obscene, vulgar, lewd, racist or sexually-oriented language.
PLEASE TURN OFF YOUR CAPS LOCK.
Don't Threaten. Threats of harming another person will not be tolerated.
Be Truthful. Don't knowingly lie about anyone or anything.
Be Nice. No racism, sexism or any sort of -ism that is degrading to another person.
Be Proactive. Use the 'Report' link on each comment to let us know of abusive posts.
Share with Us. We'd love to hear eyewitness accounts, the history behind an article.