

The metal tab pulls back with a familiar click-click-hissssss as bubbles rush to the top of the can. The alluring scent of faux orange or grape or berries wafts through the air, a familiar smell that hints at what’s to come.
What’s to come tastes good. It’s a reminder of summer, or of a childhood treat, of a sporting event or a beach day with friends. It’s OK to indulge yourself, the advertising says. You’ve earned it.
If you’re drinking a 20-ounce Mountain Dew, you’re earning the equivalent of 18 teaspoons of sugar. A same-sized Pepsi equals 16 teaspoons and a Coke comes out to 15. A 16-ounce Rockstar Energy Drink slams more than 15 teaspoons of its own.
Here’s the problem with what you’re drinking, some scientists say: Humans are not biologically designed to deal with that much liquid sugar at once. Since there’s no digestion involved, it enters the bloodstream and is absorbed more quickly than food.
As it does, the sugar overwhelms the pancreas, the organ tasked with regulating blood sugar, and over time wears it out. Welcome to Type 2 diabetes. That much sugar hits the liver like a freight train – the liver doesn’t know what to do with it all, other than convert it into fat, leading to higher rates of fatty liver disease. That’s a condition that once used to be seen mostly in alcoholics.
Harold Goldstein, a doctor of public health, offers up the statistics on the amount of sugar in the most popular drinks off the top of his head – and then he sends a chart. Goldstein is the founding executive director of the California Center for Public Health Advocacy (CCPHA), a Davis-based nonprofit whose mission is to look for solutions to what scientists say is an alarming increase in diabetes and obesity in California.
About five years ago, the CPHA commissioned a study by the UC Center for Weight and Health to see if there was a correlation between obesity and sugary beverage consumption.
The UC study found that between 1977 and 2001, Americans on average were consuming 278 more calories a day than before, with 43 percent of those calories defined as new beverage calories.
“I had no idea what the answer was going to be, but what they came up with was simple and compelling,” Goldstein says. “I was stunned. It was twice as much as I guessed.”
We weren’t just eating more. We were drinking more. And mostly, we were drinking more sugar, a phenomenon that coincided with the “soda wars” of the ’70s and ’80s, where Coca Cola and Pepsi went head-to-head on television advertising campaigns to win the hearts, tastebuds and dollars of consumers. It also coincided with an increase in portion sizes: In the ’70s and ’80s, a 12-ounce can was the norm. Now fast-food restaurants offer 32-ounce cups with free refills, and thirsty consumers can find sugar-sweetened drinks everywhere, from corner markets to vending machines in airport parking garages.
Another surprising statistic, this from the National Institutes of Health via Goldstein: A quarter of teenagers, or 23 percent, have pre-diabetes, an increase from 9 percent just 10 years ago.
“These beverages are tricking the body,” Goldstein says. “The pancreas goes wild and the liver says, ‘Look at all this. I better save it for a rainy day and turn it into fat.’ There is a cohort of teens that will be entering the health care system with higher rates of diabetes than ever.”
The grim statistics are why state Sen. Bill Monning, D-Carmel, backed by CCPHA and the Health Officers Association of California, is going back into battle with the beverage industry.
On Feb. 11, Monning introduced Senate Bill 203, which would require a warning label to be placed on the packaging of sugar-sweetened beverages including sodas, sweet teas, sports drinks and energy drinks.
The label would be required on drinks with 75 or more calories per 12 ounces and would read as follows: “STATE OF CALIFORNIA SAFETY WARNING – Drinking beverages with added sugar(s) contributes to obesity, diabetes and tooth decay.”
California Center for Public Health Advocacy Examples of BEVERAGES SUBJECT TO PROPOSED CA WARNING LABEL
|
Sodas |
Bottle Size (fl oz) |
Calories |
tsp of sugar |
Calories in 12 oz |
|
Mountain Dew |
20 |
290 |
18 |
174 |
|
Dr. Pepper |
20 |
250 |
16 |
150 |
|
Pepsi |
20 |
250 |
16 |
150 |
|
7 Up |
20 |
250 |
16 |
150 |
|
Coca-Cola |
20 |
240 |
15 |
144 |
|
Sierra Mist |
20 |
240 |
15 |
144 |
|
Sprite |
20 |
240 |
15 |
144 |
|
Diet Coke |
20 |
0 |
0 |
0 |
|
Diet Dr. Pepper |
20 |
0 |
0 |
0 |
|
Diet Pepsi |
20 |
0 |
0 |
0 |
|
Diet Mountain Dew |
20 |
0 |
0 |
0 |
|
Energy Drinks |
||||
|
Rockstar Energy Drink |
16 |
280 |
18 |
210 |
|
Starbucks Doubleshot Energy |
15 |
210 |
13 |
168 |
|
Amp Energy |
16 |
220 |
14 |
165 |
|
Monster Energy |
16 |
210 |
13 |
158 |
|
Red Bull |
8.4 |
110 |
7 |
157 |
|
Monster Rehab |
15.5 |
20 |
1 |
15 |
|
Rockstar Sugarfree |
16 |
0 |
0 |
0 |
|
Red Bull Total Zero |
12 |
0 |
0 |
0 |
|
Sports Drinks |
||||
|
Gatorade G Recover 03 Protein Drink |
16 |
220 |
14 |
165 |
|
Powerade Fruit Punch |
20 |
130 |
8 |
78 |
|
Powerade Lemon Lime |
8 |
50 |
3 |
75 |
|
Gatorade G2 low calorie |
20 |
50 |
3 |
30 |
|
Powerade Zero |
20 |
0 |
0 |
0 |
|
Fruit Drinks |
||||
|
SoBe Smoothie Strawberry Banana |
20 |
250 |
16 |
150 |
|
Kool-Aid Jammers |
8 |
97 |
6 |
146 |
|
Capri Sun Sunrise |
6 |
60 |
4 |
120 |
|
V8 Splash Berry Blend |
16 |
140 |
9 |
105 |
|
Tampico Mango Punch |
20 |
150 |
9 |
90 |
|
Sunny D Orange |
16 |
110 |
7 |
83 |
|
SoBe Lean |
20 |
15 |
1 |
9 |
|
Crystal Light – Natural Iced Tea |
8 |
5 |
0 |
8 |
|
Crystal Light – Cherry Pomegranate |
8 |
5 |
0 |
8 |
|
Flavored Waters |
||||
|
Vitamin Water XXX |
20 |
125 |
8 |
75 |
|
Vitamin Water Revive |
20 |
125 |
8 |
75 |
|
Vitamin Water Zero Go-Go |
20 |
0 |
0 |
0 |
|
Vitamin Water Zero Power-C |
20 |
0 |
0 |
0 |
|
Glaceau SmartWater |
12 |
0 |
0 |
0 |
|
Sweetened Teas |
0 |
|||
|
Snapple Peach Tea |
16 |
160 |
10 |
120 |
|
Arizona Green Tea |
23 |
210 |
13 |
110 |
|
Diet Snapple |
16 |
25 |
2 |
19 |
|
Lipton Diet |
20 |
0 |
0 |
0 |
If the immediate reaction from the beverage industry is any indication, Monning faces an uphill battle. They’re willing not only to put a lot of muscle and money behind the effort to stop him, but also to try to stop information they deem harmful to their industry from reaching the public.
But the soda lobby has another problem besides Monning. The day after this story goes to print, the Monterey County Health Department will release a report on sugar-sweetened beverages that will not exactly say sodas are fine for you.
It’s been delayed for more than two years because someone higher up the food chain brought down pressure. Which adds even more fizz to the pop drama.
Before we get into the influence wielded by the beverage industry, let’s take a peek at what’s coming in the report.
Due to be released March 6, it’s based on research conducted between 2011-2012 by a tri-county organization – San Benito, Santa Cruz and Monterey counties – called the Nutrition & Fitness Collaborative of the Central Coast, as part of the nationwide initiative called “Rethink Your Drink.” The aim is straightforward: getting people to reduce their consumption of sugary drinks.
Christine Moss is a staffer to the collaborative – and the Monterey County Health Department’s chronic disease prevention coordinator. Before her 15 years with County Health, Moss worked for the grant-funded California Health Collaborative in Fresno.
Those bona fides mean a few things: She knows what she’s talking about, she knows pressure when she sees it and she’s experienced enough to not have crumpled under pressure from the industry – pressure that included a phone call from an American Beverage Association representative while the collaborative was gathering its data.
“He wanted to make sure we weren’t doing anything silly like pushing for a soda tax,” she says. “I explained to him we couldn’t work on something like that, because our funders wouldn’t allow it.”
Epidemiologists began the survey in 2011, seeking to track the sugary beverage consumption habits of 250 people in each of the three counties. They found participants at health clinics and in laudromats waiting for their clothes to dry. In the end, they collected 1,053 surveys and completed the survey work by late 2012.
“Anyplace we could get a group together, we did a survey,” Moss says. “That way we could get a nice representative group of people. That was important to us.”
The aim was to release the survey a few months into 2013.
Yes, that means it is a full two years late. What happened?
“We were touchingly naive,” Moss says. “We started to realize this was very controversial. We got lots of pushback. Our state funder, the California Department of Public Health, had lots of questions and cautions.
“We would send in our surveys and get them sent back and they asked for very precise changes,” she says. “I wasn’t quite sure of the intent, but the approvals each step took a lot of time. It pushed back our timeline a long way.”
Examples of that pushback: Moss says she was not allowed to use imagery people might think of as a specific soda can – no red backgrounds with silver swirls, or blue backgrounds with red and white imagery. And she was discouraged from using the word “soda” in the report; it may have slipped in, she says, in at least one instance, but the report mostly references sugar-sweetened beverages.
“I expect it’s a trigger word for certain special interests,” Moss says, “but we found it’s much broader than soda.”
While the health department wants to keep the findings under wraps until the March 6 big reveal at a press conference, Moss offered a preview. The research found what she calls “two big shockers.”
First, as soda sales have started to plateau, companies have ramped up their advertising for energy and sports drinks, specifically targeting 11 – to 17-year-olds.
“The numbers will knock your socks off. For every second-grade teacher wondering why kids are so hopped up, caffeinated drinks are big,” Moss says.
The other big shocker: Nobody’s drinking much water. They’re doing a little better in Santa Cruz County, and a little worse in San Benito and Monterey counties, but still, water consumption isn’t where it should be.
And finally the report is where it should be: in the public’s hands.
“Six months turned into two years,” Moss says. “We worked very hard to make sure this was data we can stand behind. We know we’re going to be challenged, and we have made sure we’re solid.”
The Weekly reached out to the California Department of Public Health and provided a list of questions about the report and its delay, asking for a response within two days. They were unable to respond by the paper’s print deadline.
That brings us to the money and influence the beverage industry wields throughout the state. Here are just a few examples.
Last June, on the same day Bill Monning’s previous labeling bill died in the state Assembly Health Committee, PepsiCo spent $2,200 on a catered event for 13 legislators and more than three dozen legislative staff members from the Latino Legislative Caucus, as the Sacramento Bee reported. Of the legislators who attended, two voted against SB 1000, the previous iteration of the labeling bill.
Later that day, the Bee reported, PepsiCo representatives took Assemblymembers Luis Alejo, D-Watsonville, and Freddie Rodriguez, D-Pomona, to dinner. Alejo, who this year became head of the Latino Legislative Caucus, didn’t vote on the bill because he’s not a member of the Assembly Health Committee. Rodriguez, who is a committee member, abstained.
Assemblywoman Lorena Gonzalez, D-San Diego, voted against it. She said at the time that a decline in soda sales would lead to the loss of too many jobs in her district.
Alejo tells the Weekly the timing was coincidental. The PepsiCo event had been planned for more than a month and featured a book signing by Richard Montanez, a former janitor who became a PepsiCo executive – and the inventor of Flamin’ Hot Cheetos.
“Please don’t jump to inaccurate conclusions,” Alejo writes in an email. “Bill hearings are only set between the author and the committee, and they choose when it will be heard.
“As for my thoughts on any of these bills, my mind remains open and I look forward to hearing more about the merits of this particular bill as it moves forward this session,” he writes. “Past versions have never come to me for a vote.”

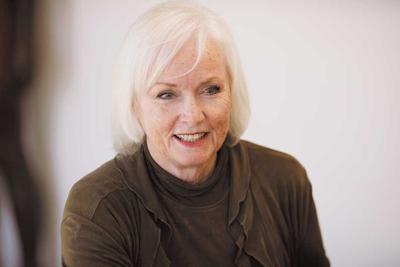
Christine Moss, a chronic disease prevention specialist with the Monterey County Health Department, helped coordinate a study on sugar-sweetened beverage consumption in the tri-county area. The release of that report has been delayed two years. “We were touchingly naive” about pushback, she says.
In 2014, the American Beverage Association California Political Action Committee, also known as the American Beverage Association Strategic Advocacy Fund, spent $11.8 million on various candidates and measures.
Of that, $9.24 million went to the successful opposition of a soda tax floated before San Francisco voters. The group also spent $2.43 million to defeat a Berkeley soda tax, which passed despite fierce industry opposition.
The PAC donated $4,100 to Alejo for Assembly, and the same to the Senate campaign of Ben Hueso, the San Diego Democrat who is vice chair of the Latino Legislative Caucus.
It put $27,200 into Gov. Jerry Brown’s campaign and $3,000 into Attorney General Kamala Harris’ too. It gave $46,000 to the Democratic State Central Committee of California and $10,000 to the California Republican Party. (For more information, see box at right.)
Fast forward to this year. The PAC started 2015 with $504,000 in the bank. The spokesman for the Latino Legislative Caucus PAC and foundation, Roger Salazar, is now the spokesman for CalBev, also known as the California-Nevada Beverage Association, the trade association representing the non-alcoholic beverage industry in California and Nevada.
The Cal-Nev Soft Drink Association PAC spent $37,371 on various campaigns in 2014, mostly as $1,000 contributions to individual legislators.
In the hours and days that followed Monning’s announcement of his labeling bill, SB 203, CalBev went on the offensive.
In a written statement, CalBev Executive Director Bob Achermann says obesity and diabetes are more complicated than a warning label. Monning’s bill is “misguided,” singles out soft drinks while ignoring sugar-rich cupcakes, donuts and processed foods, and is riddled with loopholes that will confuse consumers, according to the statement.
For example, the release says, fountain sodas purchased at restaurants with table service will be exempt from labeling. The release also calls out milk-based products like Frappuccinos and lattes, which contain as much sugar and more calories than soft drinks.
Salazar says the industry has taken on an initiative to reduce sugar-sweetened consumption 20 percent by 2025.
“There are ways you can have a collaborative effort, but bills like this seek to demonize an industry with a shocking label when there are other, broader causes to obesity and diabetes we should be looking at,” Salazar says. “It’s about balancing calories, and there’s no question we support programs that educate people about nutrition and exercise.”
But the statement that there could be a collaborative effort came as news to Monning.
“They haven’t proposed any compromises to us that would work for them,” Monning says. “I think we’ve maintained open and cordial conversation. Their position on labeling is, they provide caloric information on the label and consumers have that at their fingertips.”
Monning acknowledges other sources of sugar are out there, but says none are as dangerous.
Where’$ the Money?
In 2014, the American Beverage Association California PAC, aka American Beverage Association Strategic Advocacy Fund (a 501c6), spent $11.8 million on various ballot measures and candidates. Here’s what they gave and to whom:
- $9.24 million to Opposition to Prop. E, the city of San Francisco soda tax that voters rejected. The committee was called “Stop Unfair Beverage Taxes, Coalition for an Affordable City, With Major Funding by American Beverage Association CA.”
- $2.43 million to No on Measure D (a Berkeley soda tax, which passed)
- $27,200 to Gov. Jerry Brown
- $46,000 to Democratic State Central Committee of California
- $10,000 to the California Republican Party
- $4,100 to Alejo for Assembly, the campaign of Assemblyman Luis Alejo, D-Watsonville
- $4,100 to Ben Hueso for Senate
- $3,000 to Kamala Harris
- $1,000 each to Assembly candidates Steve Cohn, Eduardo Garcia, Connie Leyva (for senate), Autumn Burke, Bill Dodd
In 2014, the American Beverage Association California PAC, aka American Beverage Association Strategic Advocacy Fund (a 501c6), spent $11.8 million on various ballot measures and candidates. Here’s what they gave and to whom:
“While sugar is in other foods,” he says, “medical evidence is clear that liquid consumption of sugar is more immediately damaging. When you eat it, more is eliminated through digestion.”
None of Monning’s proposed legislation aimed at taxing sugar-sweetened beverages or requiring labeling thus far has made it to a vote of the full California State Legislature. Asked for his opinion of SB 203, Alejo responds he doesn’t have much to say because he hasn’t yet read it.
Achermann contends it’s counterproductive to suggest legislation impacting only some beverages will be effective.
“If consumption of sugar-sweetened beverages is going down and diabetes is going up, then how are soda and other sweetened beverages driving the problem?” he writes.
Goldstein agrees on one point: soda consumption is going down. Americans now drink an average of 44 gallons of soda a year, a 17-percent drop from the peak in 1998, he says. But the percentage of adolescents drinking sports, energy or sweetened fruit drinks is on the rise, from 31 percent in 2009 to 38 percent in 2012.
The ultimate question might be, “Will a warning label work?” The fact that industry is fighting so hard against it indicates it might. Assemblymember Gonzalez so feared a label would lead to job loss that she voted against an earlier version of the bill, according to the Sacramento Bee.
Monning says it’s hard to forecast whether it will succeed this time around.
“I never make predictions,” he says in a phone call from his office in Sacramento. “We got through the Senate last year. You do build on persistence in this building.” Later, he adds that the more the labeling issue is before the public, the more it’s likely to resonate.
Goldstein, the public health doctor, isn’t sure what’s so controversial about a warning label. His center’s polling research shows that 74 percent of California voters support labeling, and that includes 63 percent of Republican voters, 86 percent of Latino voters and 80 percent of African-American voters.
“In some ways, labeling is the most Libertarian of all public policies,” Goldstein says. “It says consumers have the right to know and should be able to decide for themselves on the truth. The beverage industry wants to continue hiding behind a marketing message.”
A different kind of persistence, Moss thinks, proves the very power of a warning label.
“The statistic I hear about getting people’s attention is that you need to hear a message 11 to 13 times before it sinks in,” she says. “If you have to look at it every time, maybe that’s the loading dose. Maybe it will lead to the question, ‘Is this the best choice I can make?’”
(0) comments
Welcome to the discussion.
Log In
Keep it Clean. Please avoid obscene, vulgar, lewd, racist or sexually-oriented language.
PLEASE TURN OFF YOUR CAPS LOCK.
Don't Threaten. Threats of harming another person will not be tolerated.
Be Truthful. Don't knowingly lie about anyone or anything.
Be Nice. No racism, sexism or any sort of -ism that is degrading to another person.
Be Proactive. Use the 'Report' link on each comment to let us know of abusive posts.
Share with Us. We'd love to hear eyewitness accounts, the history behind an article.